Scrape Cloudflare Tunnel With Prometheus & Display Data in Grafana
Now that I’m using Cloudflare Tunnel or cloudflared as my ingress for Kubernetes, I wanted to gather some metrics from these pods, just to get an overview of what’s going on there. cloudflared exposes a metrics endpoint which can be scraped by Prometheus and fed into Grafana to have some fancy graphs.
Here’s a guide on Grafana.com how the two tools work together.
Prometheus Stack
I’m using the prometheus-community/kube-prometheus-stack helm chart to deploy the initial monitoring stack to get Prometheus and Grafana up and running.
It’s best to follow the instructions on GitHub to install it, as they also have the latest information there on how to do this.
PodMonitor for cloudflared
When Prometheus and Grafana are up, you can configure a PodMonitor to tell Prometheus to scrape all the information from the individual cloudflared pods. To do so, I make the following assumptions about the Kubernetes environment:
- Namespace for Prometheus / Grafana: monitoring
- release label: monitoring
- The cloudflared deployment has the following labels: app=cloudflaredand release: monitoring
- The metrics port name is set tohttp-metrics
Here’s a snippet to configure the deployment, secret and PodMonitor.
The snippet is a single YAML file which contains the cloudflared Deployment, the Secret to authenticate cloudflared, and the PodMonitor for Prometheus.
Query Data in Grafana
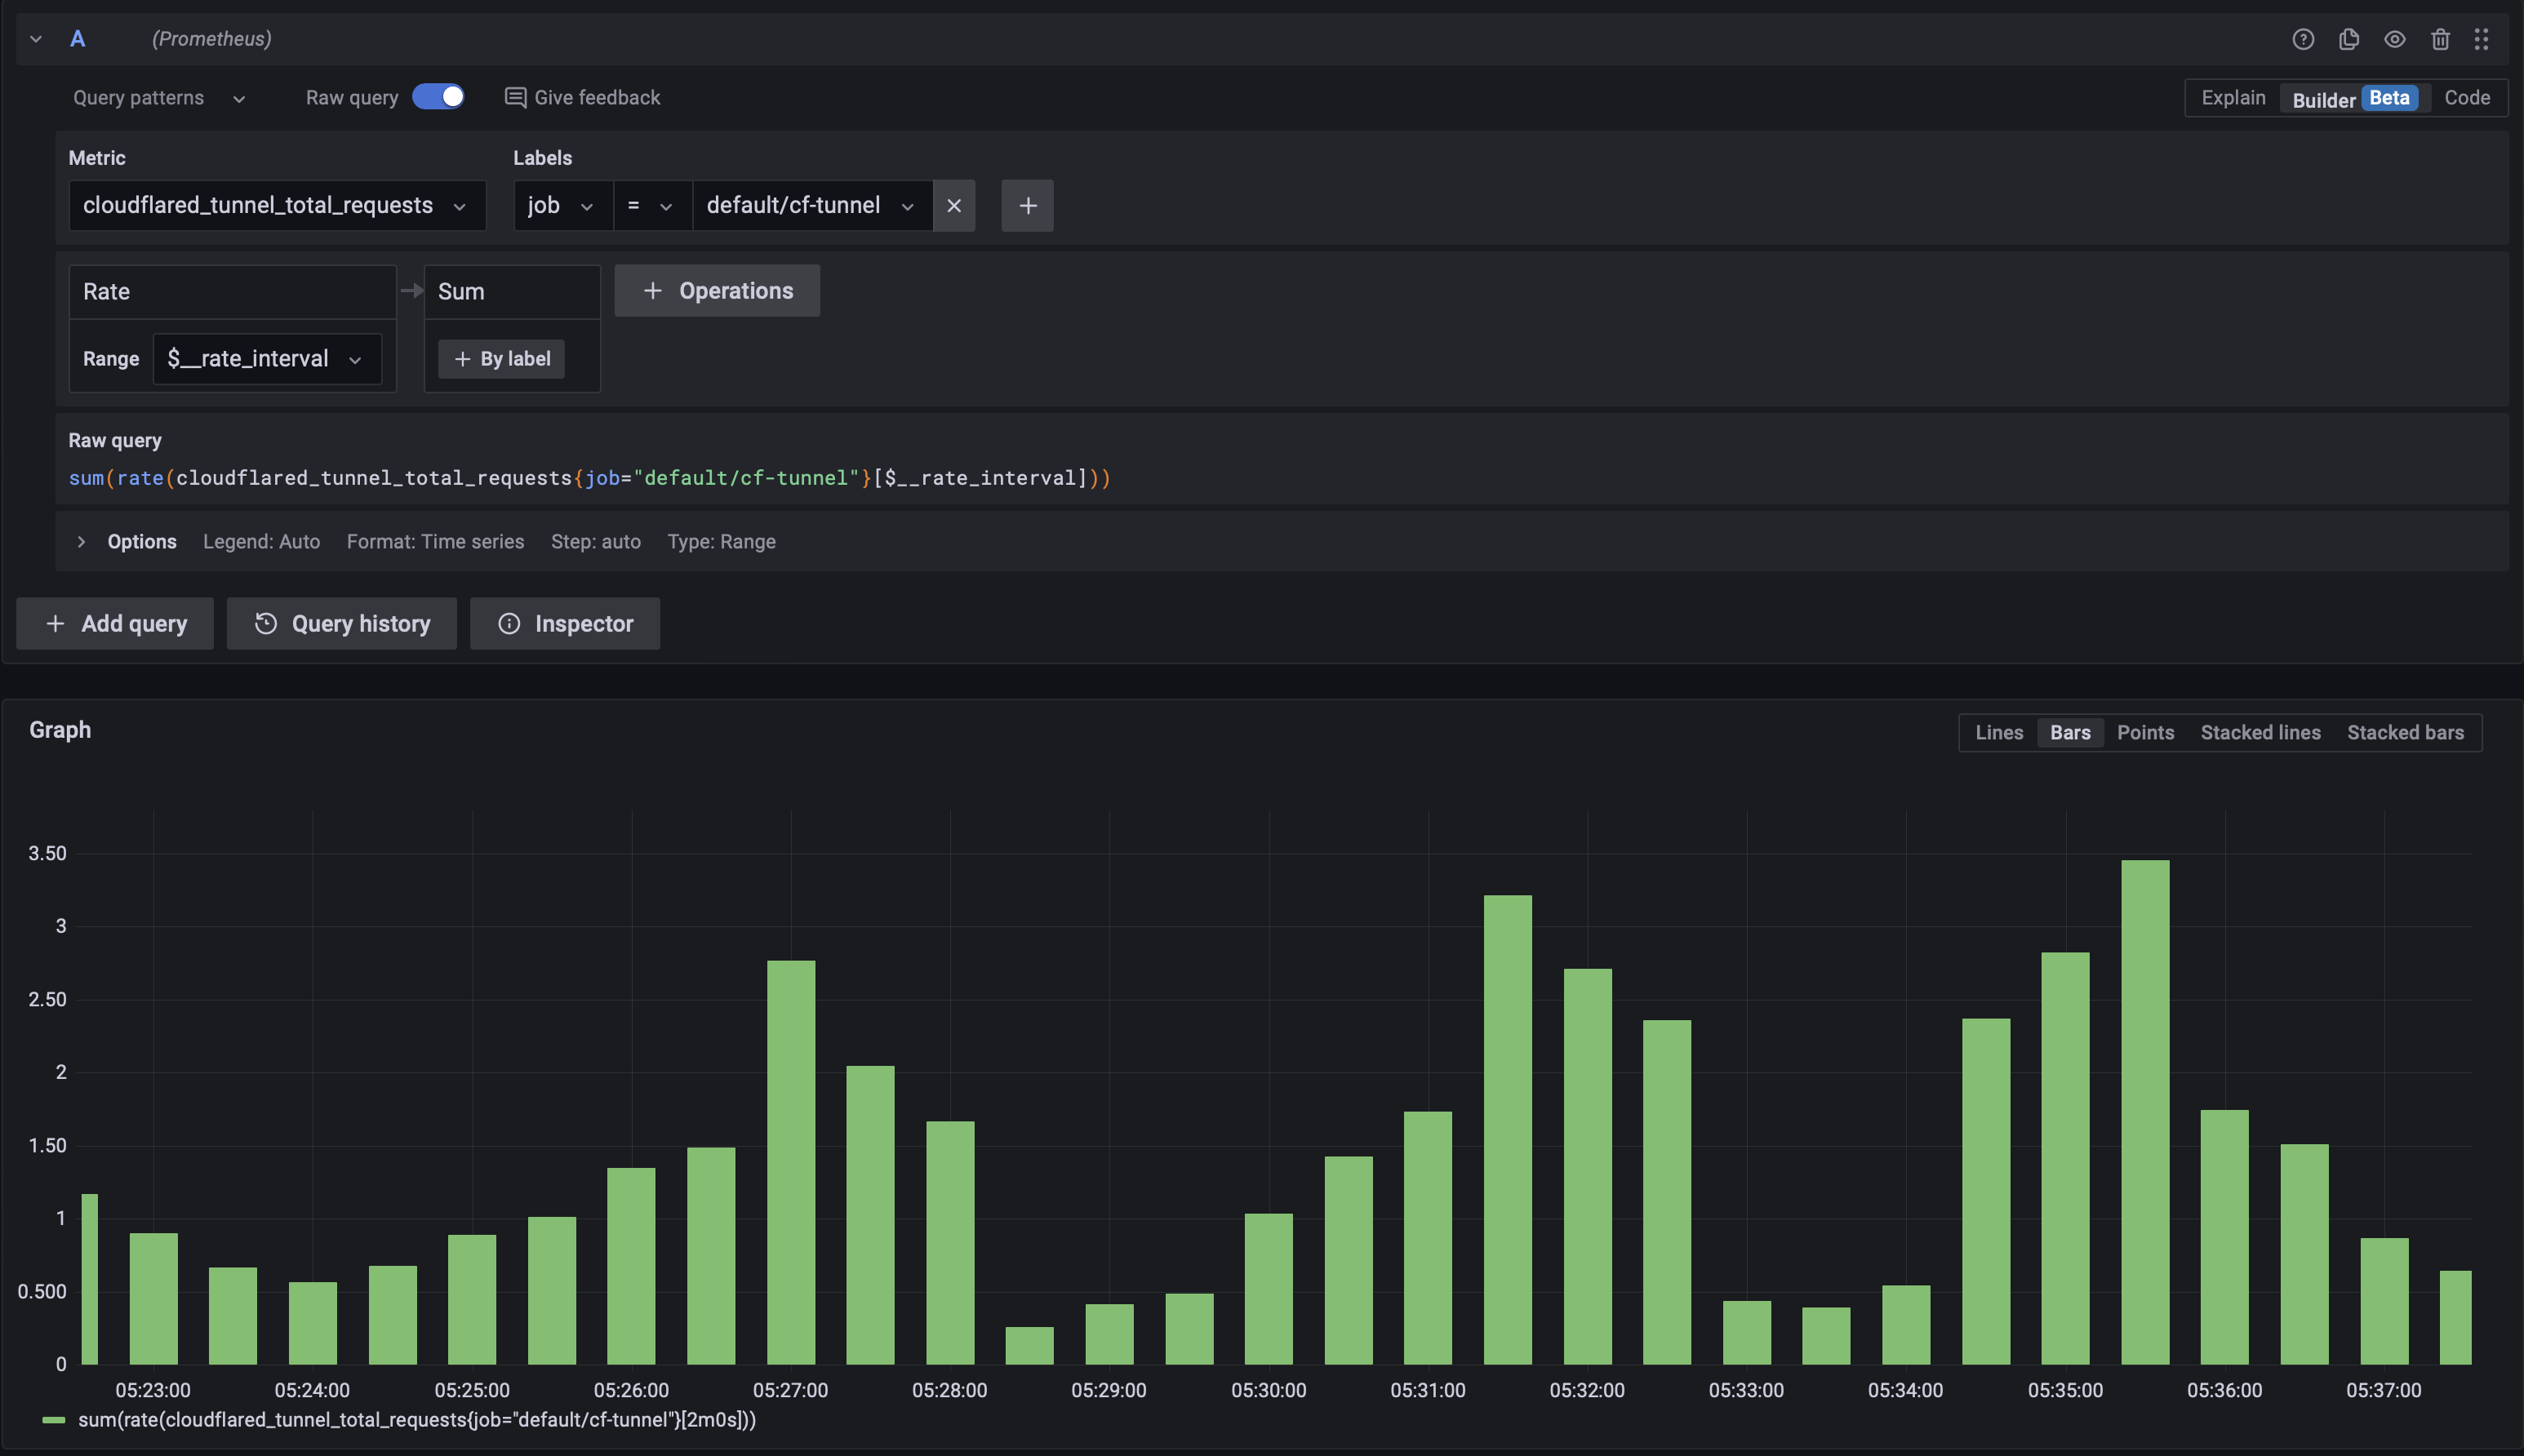
With the kube-prometheus-stack everything’s connected already, meaning data from Prometheus can be queried directly in Grafana. To do so, just get started in the Explore tab, select Prometheus as the data source and put in a query like so:
sum (rate(cloudflared_tunnel_total_requests {job="default/cf-tunnel"}[$__rate_interval]))There are also autocomplete suggestions depending on your environment, names for the deployment, pods etc.
With the rate() function you can calculate the average rate of requests in a given timeframe. There are many more functions available to make useful Dashboards.